Summary
- Asian data continues to be softer; as a result, the Bank of Korea and Indonesia each lowered rates.
- US data is fair, but there is still sufficient softness to be concerning.
- The longer-term charts still look like we're at the end of the economic cycle.
International Economic Data
EU/UK
- Annual inflation at 1.3%
- Exports up 7.1% Y/Y for Jan-May period
- Trade balance up
- ZEW economic sentiment indicator at -20.3.
UK
- Unemployment at 3.8%
- CPI Inflation at 1.9% Y/Y
- Retail sales increased by 3.8% Y/T
EU/UK conclusion: this week's news was remarkably positive. Despite international trade issues, EU trade increased at a decent clip. The ZEW sentiment indicator, however, shows that businesses are still concerned about the macroeconomic environment. Even with Brexit looming on the horizon, UK numbers were positive. Unemployment remains at low levels, which is supporting growth in retail sales. Inflation has come down thanks to lower housing costs.
China/Japan/Australia
China
- 2Q19 GDP growth at 6.2%
- Industrial production increased by 6.3% Y/Y
- Capital investment increased by 5.8% Y/Y
- Retail sales increased by 9.8% Y/Y
Japan
- Exports down 6.7% Y/Y
- Declines across all Asian exports
- Annual CPI at .7%
Australia
- Westpac leading index at .02%
- Unemployment at 5.25
China/Japan/Australia conclusion: the regional data is soft. Chinese GDP is slowing, although short-term stimulus is positively influencing industrial production and retail sales. Japanese exports to Asia were down across-the-board, indicating the ASEAN slowdown continues.
Canada/Mexico
Canada
- CPI at 2% Y/Y
- Retail sales down .1% M/M
Canada conclusion: insufficient data to draw any conclusion.
Central Bank Actions of Note
South Korea lowered rates 25 basis points to 1.50%. Here is how the bank described the South Korean economy (emphasis added):
The Board judges that the pace of domestic economic growth has slowed as construction investment has continued undergoing an adjustment and the slowdowns in exports and facilities investment have deepened, although consumption has continued to grow moderately. Employment conditions have partially improved, with the increase in the number of persons employed having risen. With respect to future domestic economic growth, the Board expects that the adjustment in construction investment will continue and exports and facilities investment will recover later than originally expected, although consumption will continue to grow. GDP is forecast to grow at the lower-2% level this year, below the April forecast (2.5%)
The South Korean economy remains in fair shape, although there are areas of softness in the business sector. GDP grew at an annualized 2.1% pace in the last quarter, although the economy contracted 0.4% on a Q/Q basis. Gross fixed capital formation has been declining since 1Q18, although it's still positive. Industrial production has been weak; it declined in four of the last five months. The central bank argued that the weak trade environment is the primary reason for this softness in business activity. But unemployment, while slightly higher, is still a very healthy 4% and retail sales increased at a 3.4% Y/Y rate in the last report.
The Bank of Indonesia lowered rates as well (emphasis added):
Indonesia’s central bank cut its benchmark interest rate for the first time in almost two years and pledged more easing to come as it shifts focus to supporting growth in Southeast Asia’s biggest economy.
.....
The decision came hours after a similar move from South Korea’s central bank and after dovish signals from the Federal Reserve that it will cut interest rates for the first time in a decade in July. It underscores central bankers’ concerns about a worsening global economy and mounting trade tensions.
“Bank Indonesia sees that the room is still open for accomodative monetary policy that is in line with the low inflation estimate and the need to push economic growth momentum further,” Governor Perry Warjiyo said in Jakarta.
On the surface, this move didn't seem necessary. GDP has grown at a 5%-5.2% annual rate in the last six quarters. The unemployment rate declined from about 6% at the end of 2018 to 5% in the latest report. Industrial production recently rose at a solid 7.9% rate while retail sales advanced 7.7%. The reason is probably export weakness; exports have been softer in three of the last six months.
US Data
The Fed released the latest Beige Book on Wednesday, which described overall US activity in the following manner (emphasis added):
Economic activity continued to expand at a modest pace overall from mid-May through early July, with little change from the prior reporting period. In most Districts, sales of retail goods increased slightly overall, although vehicle sales were flat. Activity in the nonfinancial services sector rose further. Tourism activity was broadly solid, with Atlanta and Richmond recording robust growth in this sector. Although some Districts continued to report healthy expansion in the transportation sector, others noted that activity declined modestly. On balance, home sales picked up somewhat, but residential construction activity was flat. Nonresidential construction activity increased or remained strong in most reporting Districts, and commercial rents rose. Manufacturing production was generally flat, but a few Districts noted a modest pickup in activity since the last reporting period. Agricultural output declined modestly following unusually heavy rainfall in some areas, and oil and gas production fell somewhat. Increased demand for loans was broad-based, with all but two Districts noting some growth in financing activity. The outlook generally was positive for the coming months, with expectations of continued modest growth, despite widespread concerns about the possible negative impact of trade-related uncertainty.
This report -- which is comprised by anecdotal reports from all the Federal Reserve districts -- is mostly positive. But above I've emboldened key phrases and then italicized negative clarifications where the Fed has essentially said, "things are good, but ..." This is the second consecutive Beige Book where the Fed has had to negatively clarify economic developments.
Building permits for 1-unit structures rose 0.4%:
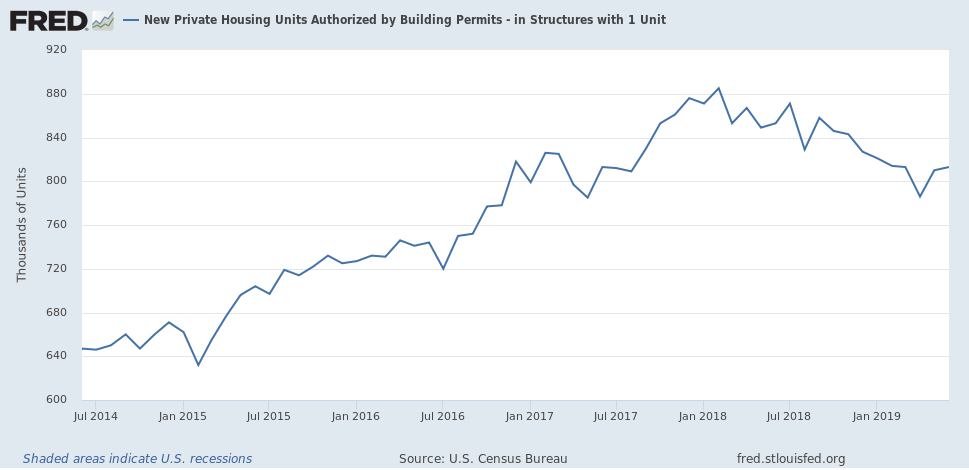
This leading indicator started to decline at the beginning of 2018 and has moved mostly lower since. It's risen modestly during the last two months. However, the overall trend is still lower and the trend is soft. Retail sales were 0.4% higher M/M and 3.4% higher Y/Y:
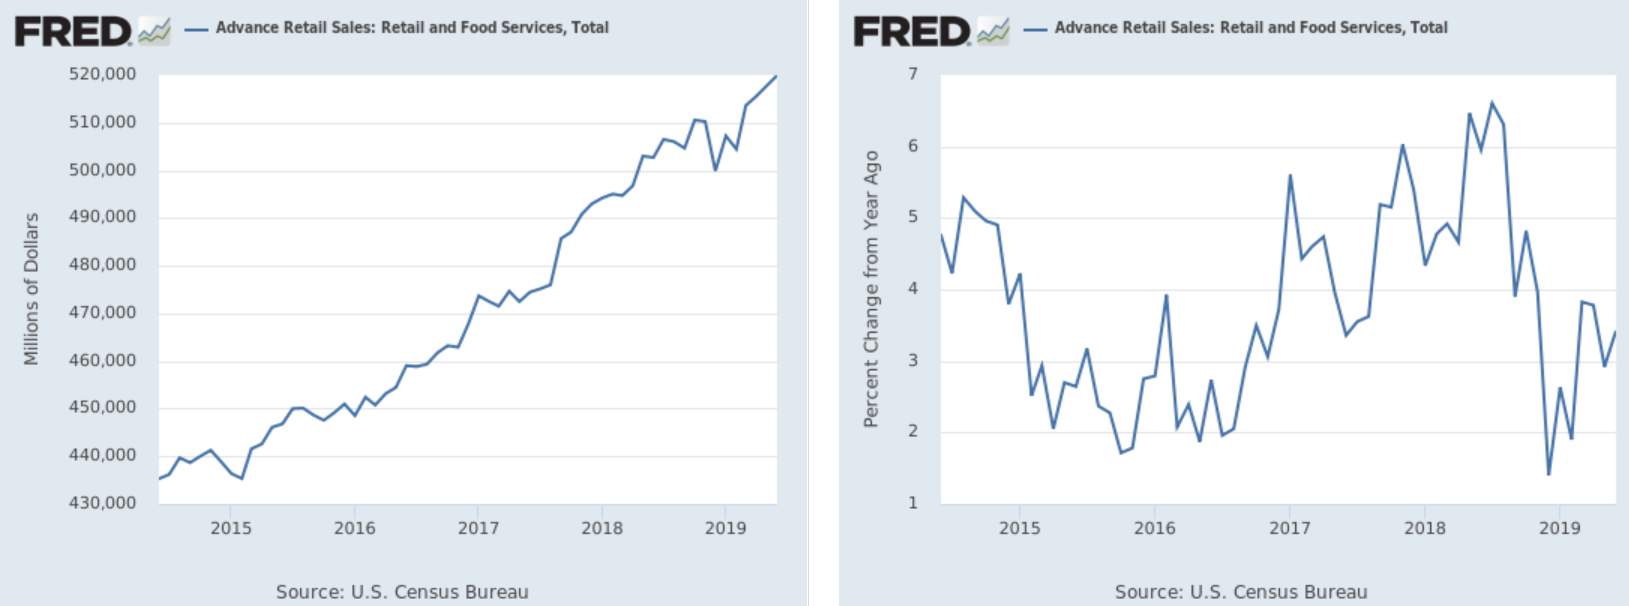
The data dipped at the beginning of 2019 when the late 2018 stock market swoon and government shutdown dampened consumer activity. But thanks to a strong jobs market, consumers have picked up their spending pace over the last few months. Industrial production was unchanged. But as with all economic reports, the devil is in the details:
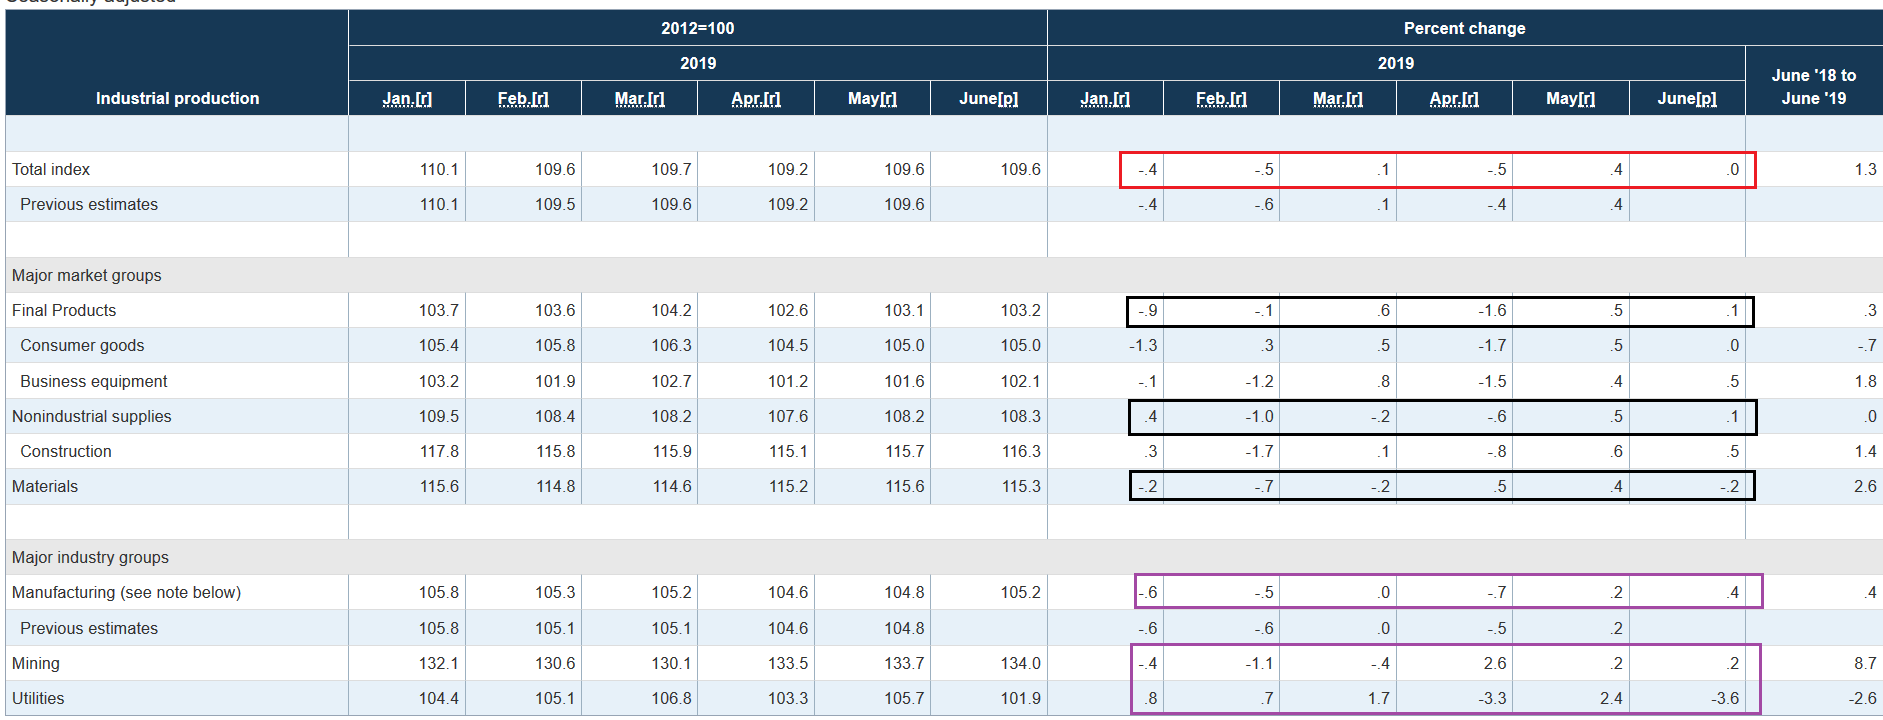
There are three color schemes above: red for the total IP number (top row), black for major market groups (second set of boxes) and purple for major industry groups (third set of boxes). There is weakness in all data sets. The topline number (in red) declined in three of the last six months and was unchanged in a fourth. Of the major market groups (second set of data in black), final products were down in half of the last six months. Note the weak reading for business equipment, which shows weak business sentiment. Non-industrial supplies contracted in three of the last six months while materials production was off four times since January. Looking at the industry groups (in purple) we see the same level of weakness: in the last six months, manufacturing and mining were down half the time. No matter how you sub-divide the data, there's softness.
US conclusion: The data is mostly good, but there is still a broad enough swath of softness to raise concerns. As the Fed noted, there are increasing anecdotal comments about weakness and softer sentiment. Housing is lower and industrial production has been weaker since the start of the year. On the plus side, retail sales have recovered from the beginning of the year slump.
US Markets
Before looking at the charts, I'd like to explain my basic market thesis. Currently -- and for the last few months -- I've been bearish. There are two reasons for this.
1.) A weaker fundamental backdrop: as I noted yesterday, the LEIs contracted in the latest report. Other leading indicators such as new orders for business equipment and housing starts are softer. And then there's the yield curve: the belly has inverted since the beginning of the year. The latest comments from Fed Chair Powell and the Federal Reserve meeting minutes also reference an overall softness. Add in the international uncertainty created by US trade policy, a slowing China and the possibility of a hard Brexit, and you have a recipe for sudden shocks that lead to an economic contraction -- which is typically how recessions start.
2.) Micro, small, and mid-caps have all underperformed this year, while Treasuries and large-caps have rallied. If traders thought the economy was about to go gangbusters, smaller stocks should theoretically outperform large-caps because small companies rely more on economic growth for revenue growth. The bond market rally is a classic end-of-the-cycle development, which ties in with the yield curve inversion referenced in #1.
For me, both of these factors combine to indicate we're at the end of the cycle (see also this column from earlier this week where I look at the longer-term charts and show there's a lot of topping activity). Now -- also note that markets are slow to act. Often the top is what I call a "slow-motion" event that happens over a 6-9 month period. To my eyes, this is what's happening this summer.
Let's now look at the charts to show this in detail, starting with the Treasury market.
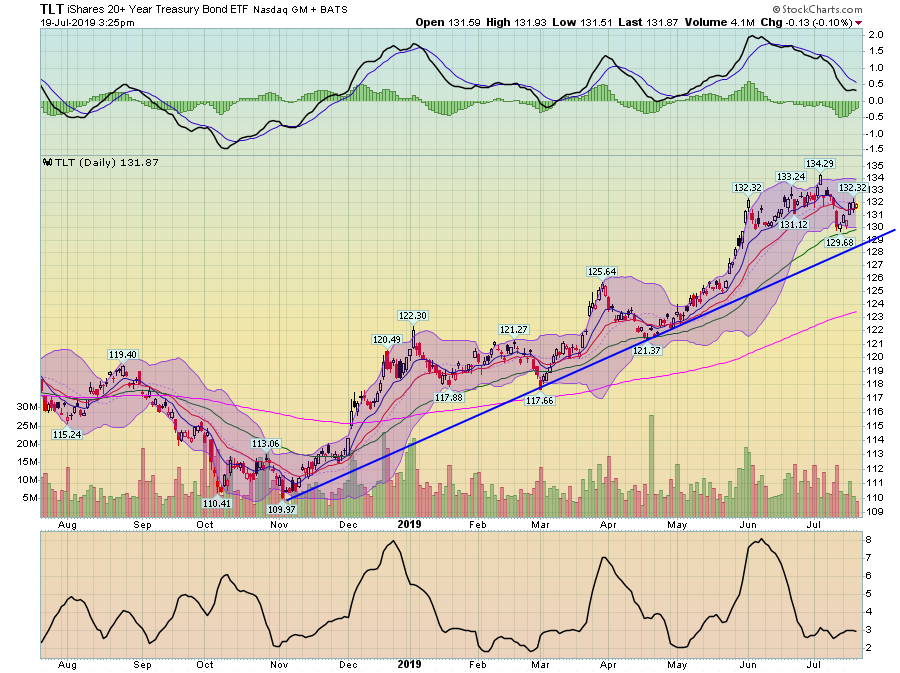
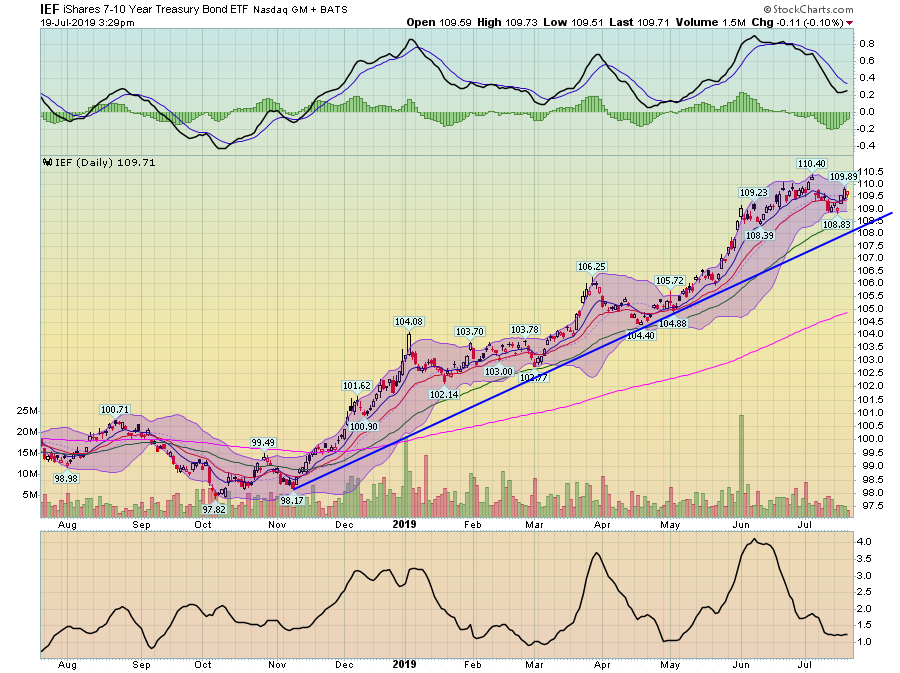
The long-end of the Treasury market (top chart) and the belly of the curve (bottom chart) are still in solid uptrends. This tells us that traders don't think inflation is on the horizon -- which is another way of saying growth is weak. Add to that the now all but certain coming rate cut, and you have further upside room in the bond market.
Weak growth also means small-caps will suffer, which they are. Let's start with the micro-caps:
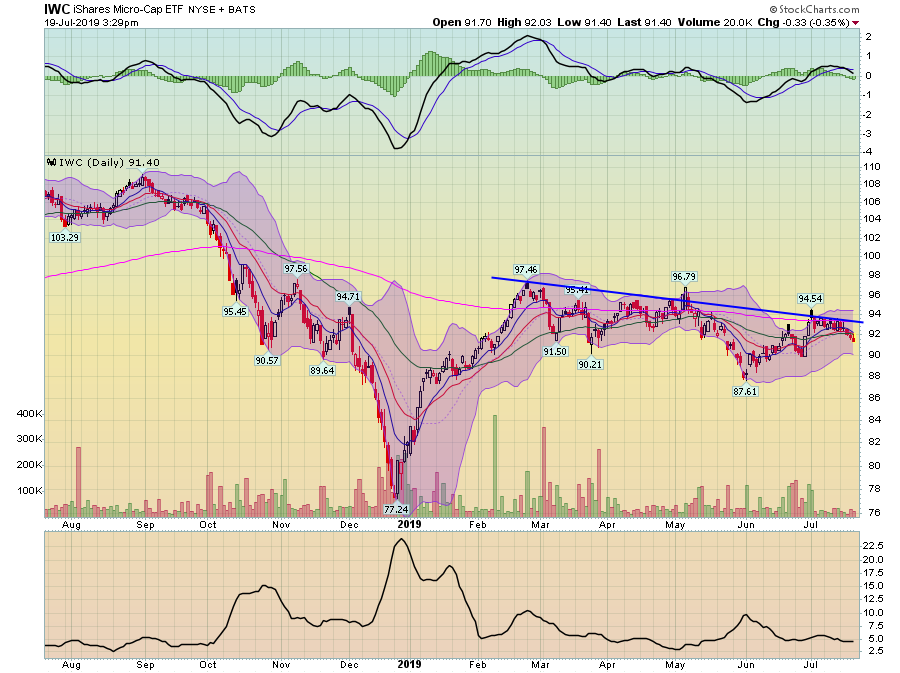
Micro-caps have a modest downtrend, which is shown by the trend line connecting highs since February and the modest downward tilt to the 200-day EMA (in pink).
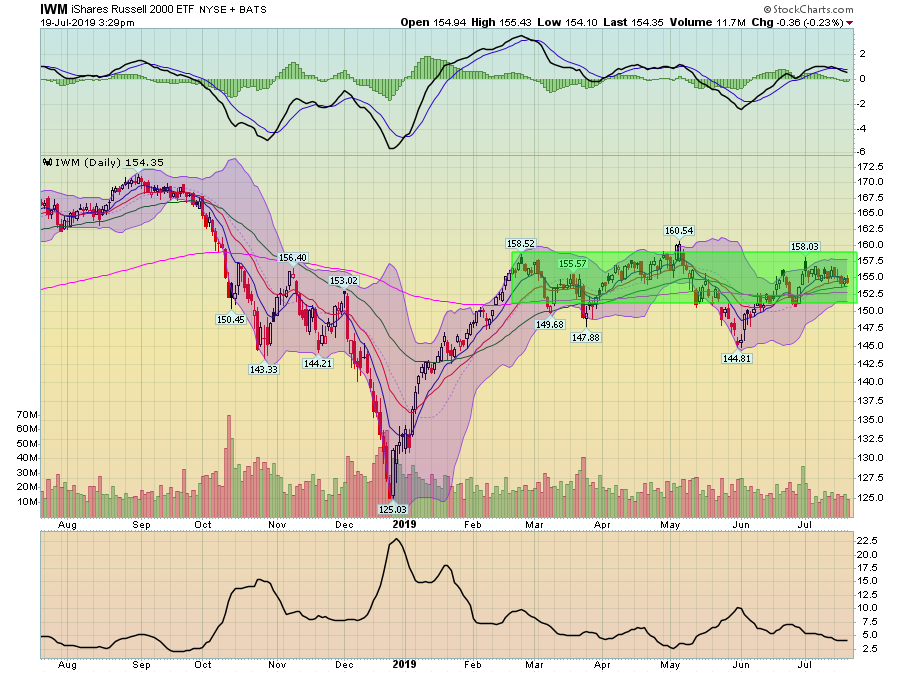
Small-caps are faring somewhat better, in that they aren't moving lower. Instead, they're moving sideways, trading between the lower and upper 150s since February.
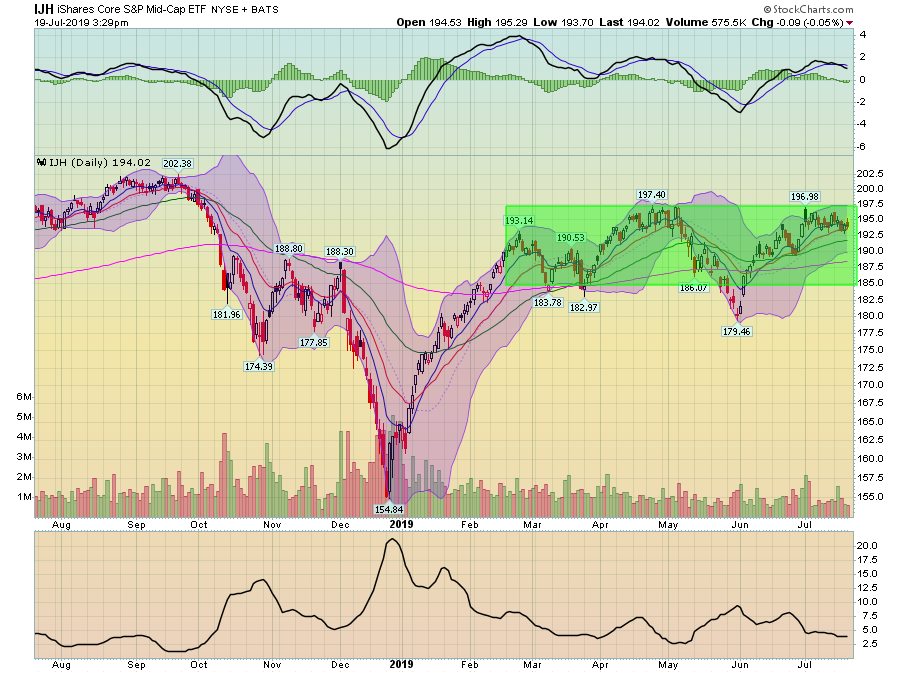
Mid-caps are in the same boat as small-caps, except the prices are different (lower-180s to mid-190s).
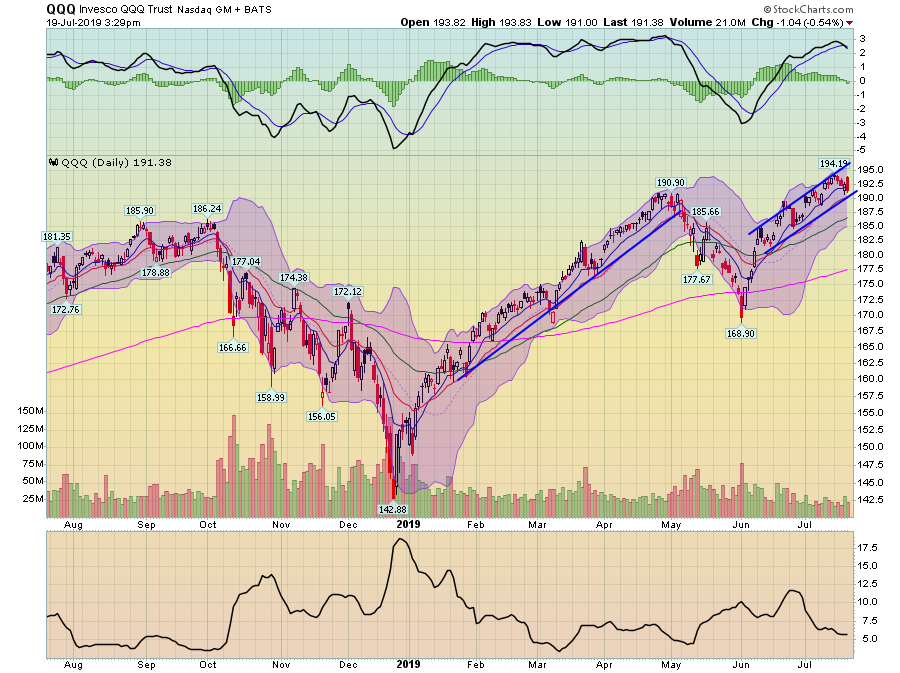
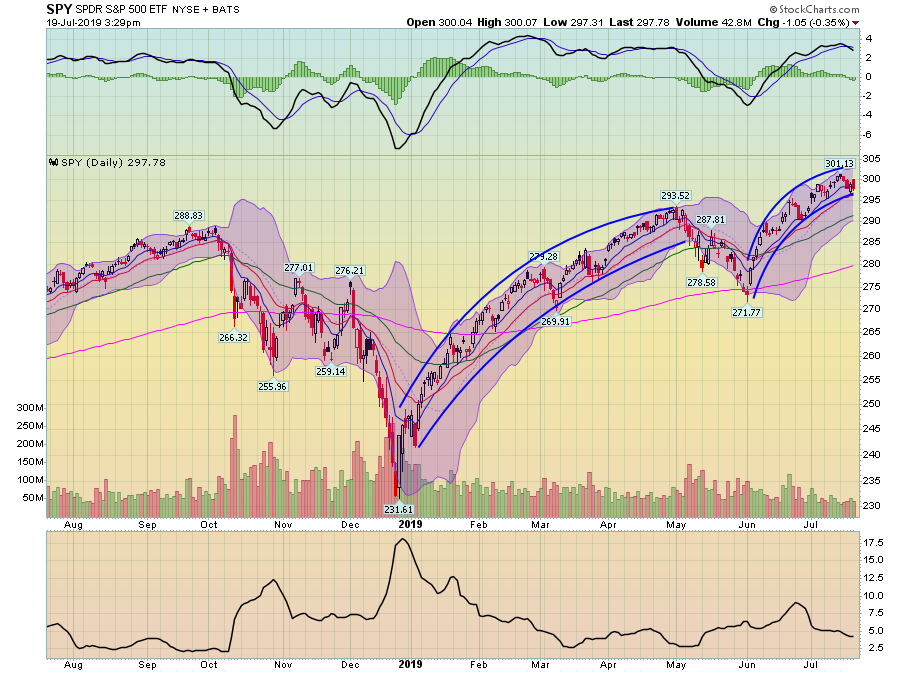
Only indexes composed of larger-cap stocks (the QQQs, above and the SPYs, below) have real upward momentum.
The total interpretation of these charts is that we're in the middle of a slow-motion top: Treasuries are rallying, small-caps are underperforming, and the larger indexes have a modest bid.
