Waving the White Flag
The price of gold rose two bucks last week, though the price of silver fell 10 cents. We have seen several analyses recently predicting big price drops, in one case by at least $500 in gold by the end of the year.
Is this what capitulation looks like? It’s said they don’t ring a bell at the top, but they don’t ring a bell at the bottom either.
We have also seen technical analysis arguing that silver is about to break out and that gold is bouncing off its support (which is said to be $1,250). What could drive the prices of the metals higher?
Whenever we ask this question, we mean durably. Of course, speculators in the futures markets could begin to buy long positions with leverage. But then what? Such buying inevitably turns to selling, unless there is real buying of the metal.
Right now, so far as we can see, there is weak demand for retail coins and bars. The Indian rupee has been falling all year. The average Indian is about 7% less able to buy gold now than he was at the end of December. The Russian ruble peaked at the end of January, and is now down 11.65. The Chinese yuan is down about 6% since its peak in early February.
The reason for these big currency moves is simple. All around the world, governments and corporations have previously borrowed US dollars. Their revenues are in their local currencies. This mismatch creates a risk.
It’s great when everyone from currency traders to yield-starved fund managers are borrowing dollars, to sell them short and buy other currencies. Then the local currency, which is their asset, is rising against the dollar which is their liability. Eventually, the tide turns.
It becomes a bit harder to generate local currency revenue. Perhaps because the world seems to be headed towards a repeat of the tariff policies that exacerbated the last great depression.
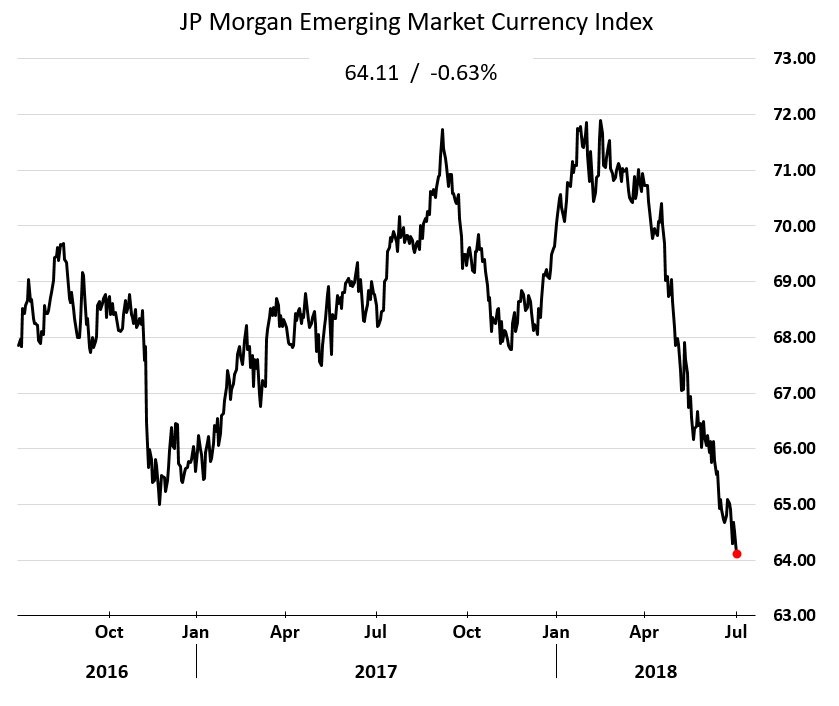
JP Morgan emerging market currency index, above (via The Daily Shot) – the expert term for this chart formation is “relentless nosedive”. Perhaps because it is time for the cycle to turn. Perhaps because QE has become QT. It could even be that market participants lower their estimate of the quality of the debt backing these currencies.
Whatever the reason, market selling begins pushing these currencies down. This compounds the problems of dollar-debtors around the world. This makes their local currency bonds even less attractive, and hence their local currency too. What was a lot of fun on the way up, turns into a lot of pain on the way down.
Add to this the fact that interest rates in the dollar have risen. The cost of funding such “carry trades” is much higher, and the attractiveness of other higher-rate currencies is less compared to the dollar, than it was a few years ago.
This, by the way, is what it means that the dollar is the world’s reserve currency. The reserve currency is not whatever oil is priced in — oil is priced in dollars because it is the reserve currency.
It is that the dollar is an asset on every major balance sheet in the world. The other currencies are dollar-derivatives. It is appropriate to describe their motion up and down with reference to the dollar from which they derive.
We are painting a picture of credit stress. The first phase of such stress is a general impoverishment, reduction in profits, wages, and savings. This is not an environment for accumulating gold or silver.
The question is will the second phase come, a.k.a. fear. This is when investors (those who are still solvent) rush to trade some of their paper for metal. When they don’t like the risk posed by the counter-parties who issue that paper.
We are not embedded in the culture in India or Russia or China. We can speak only to America, and right now, there is a general optimism that GDP is doing great, the stock market is going great, employment is doing great, and even policies that harm the economy like tariffs are great.
This won’t last, as these purported signs of greatness show accelerated capital consumption (along with the rise in debt levels). Not even counting the impact of tariffs which has not been felt yet.
So what would the reason be for someone to stack more gold and silver today? We don’t refer to someone who owns no metal (we always advise people to own some, and not worry about price for their first purchase). We mean someone who owns a few tubes of gold Eagles and a few monster boxes of silver. What is the reason for adding more?
Is it the greed to get rich when the price will suddenly skyrocket, that no more metal will be for sale soon? Seriously, after all this time, and all these gold-to-$50,000-stories not to mention deadlines for monetary doomsday (according to that sales squeeze page we’ve been mentioning, the one that had been urging action before July 1… the end of the world has now been rescheduled for December 31).
Is it the fear that the banks are failing? We see no backwardation in gold or silver. Nor any reports of major US banks about to fail. It’s a different story in Europe, and that will make Europeans want to sell their euros to buy dollars and deposit them in US banks. Gold will always be the distant second to the dollar in such trades.
We do see something that could precipitate a sustained buying trend and drive the price higher. The issuance of a gold bond by an AA-rated government: Nevada. If you live in this state, please call your legislators and tell them you support this historic measure.
Fundamental Developments
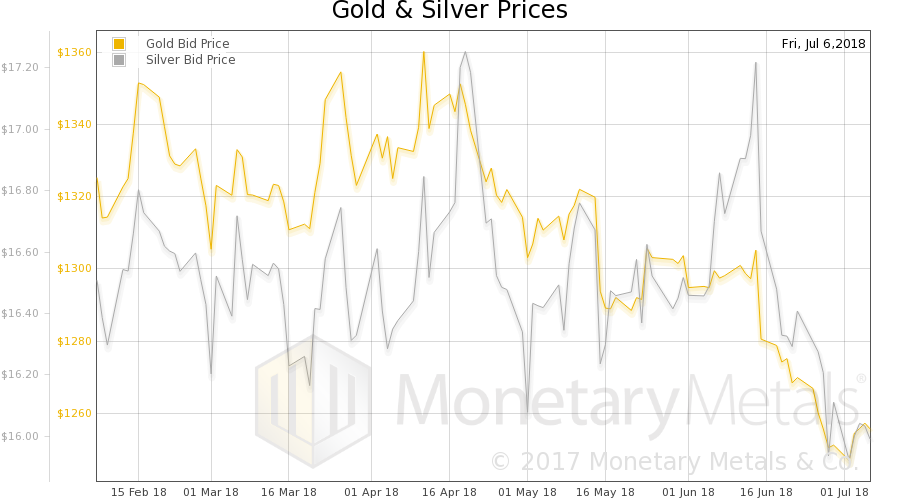
So whither the price of gold next? We will provide a picture of the changing gold and silver fundamentals. But first, here is the chart of the prices of gold and silver.
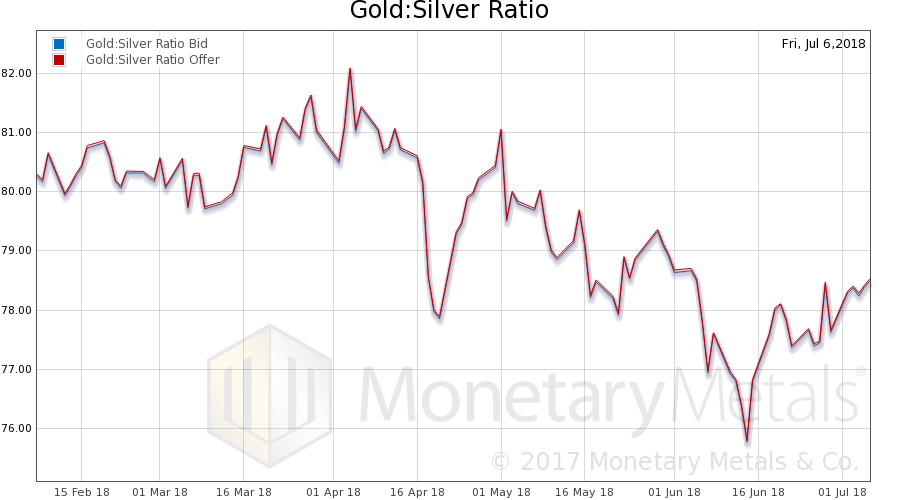
Next, this is a graph of the gold price measured in silver, otherwise known as the gold-to-silver ratio. It went up this week.
Here is the gold graph showing gold basis, co-basis and the price of the dollar in terms of gold price.
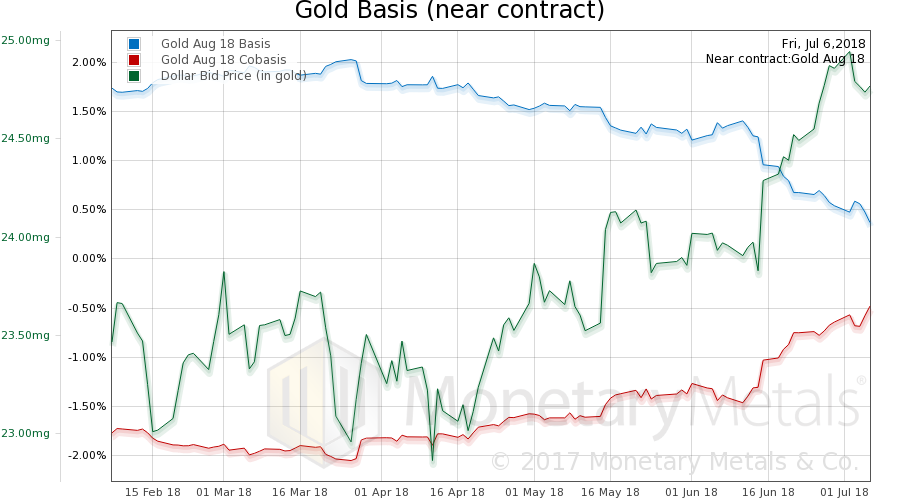
Gold basis, co-basis and the US dollar priced in milligrams of gold.
Look at that – scarcity (i.e., the co-basis) is rising. However, last week the price did not fall. The Monetary Metals Gold Fundamental Price went up $2 last week to $1,300.
Now let’s look at silver.
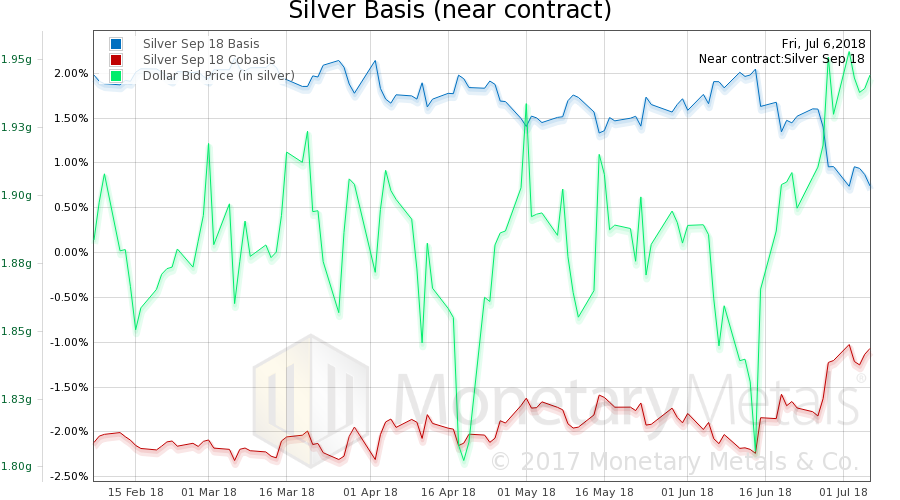
The same thing in silver, a rising co-basis, though against a drop in price. The Monetary Metals Silver Fundamental Price fell 2 cents, to $17.44.
